


This article was featured in Maine Seniors Magazine, June 14, updated through 12/31/2019
Sequence of Investment Return Risk– The “FLAW” of Averages
With the bull market in U.S. stocks reaching its 5 year anniversary and most companies trading at multiples of current earnings that exceed historical averages, I thought it was a good time to get a little nerdy with numbers and write about a risk that doesn’t get a lot of attention in good markets: “Sequence of Return Risk.”
The financial services industry has done an excellent job over the years of training investors to expect 10% average annual returns from the stock market. Unfortunately, it has largely failed to emphasize the importance of the sequence of annual returns for retirees who withdraw a consistent percentage (typically 4%-5%) of their portfolios annually.
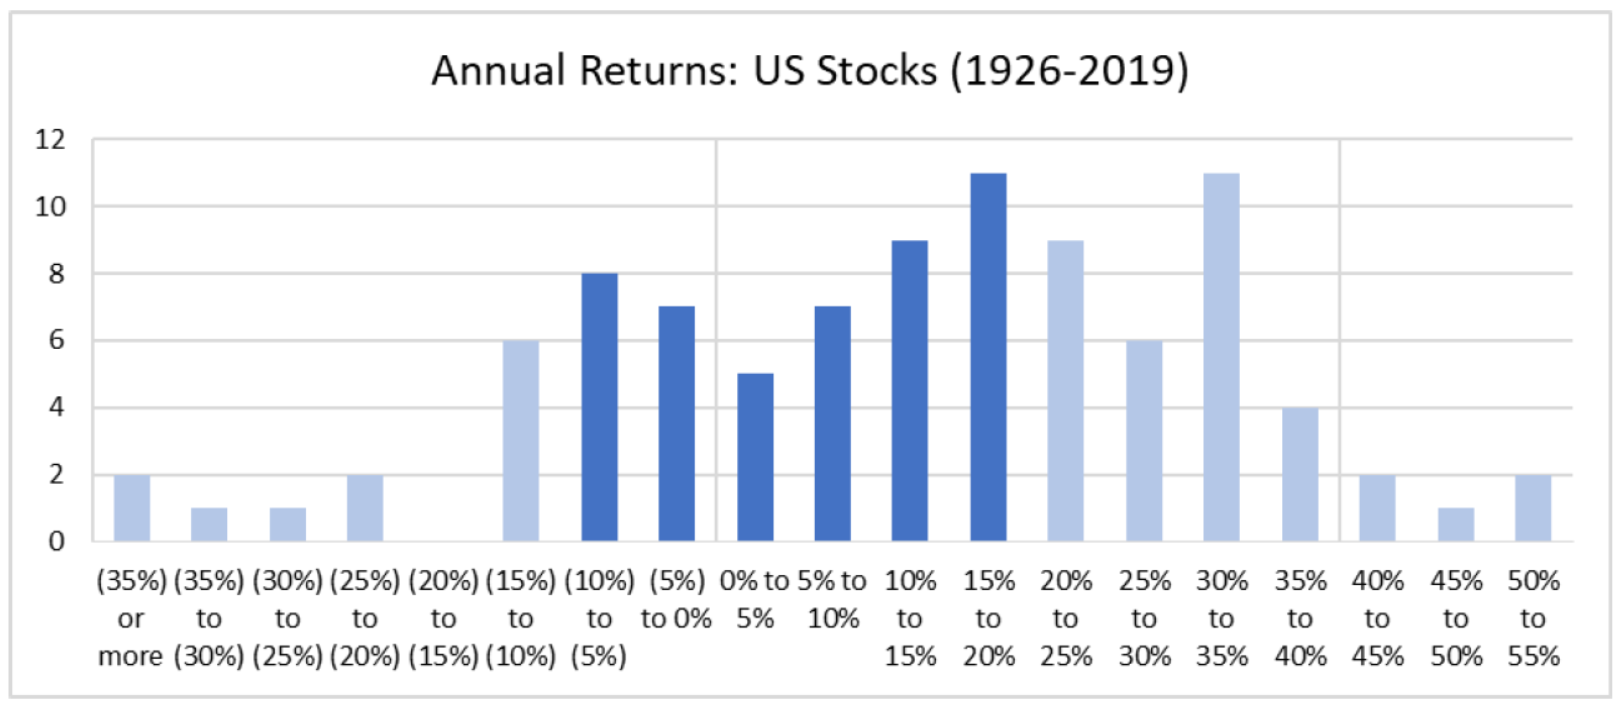
In reality, although the stock market as measured by the Standard & Poor’s 500 index has indeed averaged 10.29% per year since 1926, the yearly returns have rarely been anything close to 10%. As the chart below illustrates*, in only 7 of the 95 years since 1926 has the return been between 5% and 10%. In addition, there have been 12 years in which the loss was 10% or more and in 6 of those years (including 2002 and 2008) the market fell by more than 20%.
Sequence of return risk only exists for an investor in the distribution phase, not the accumulation phase:
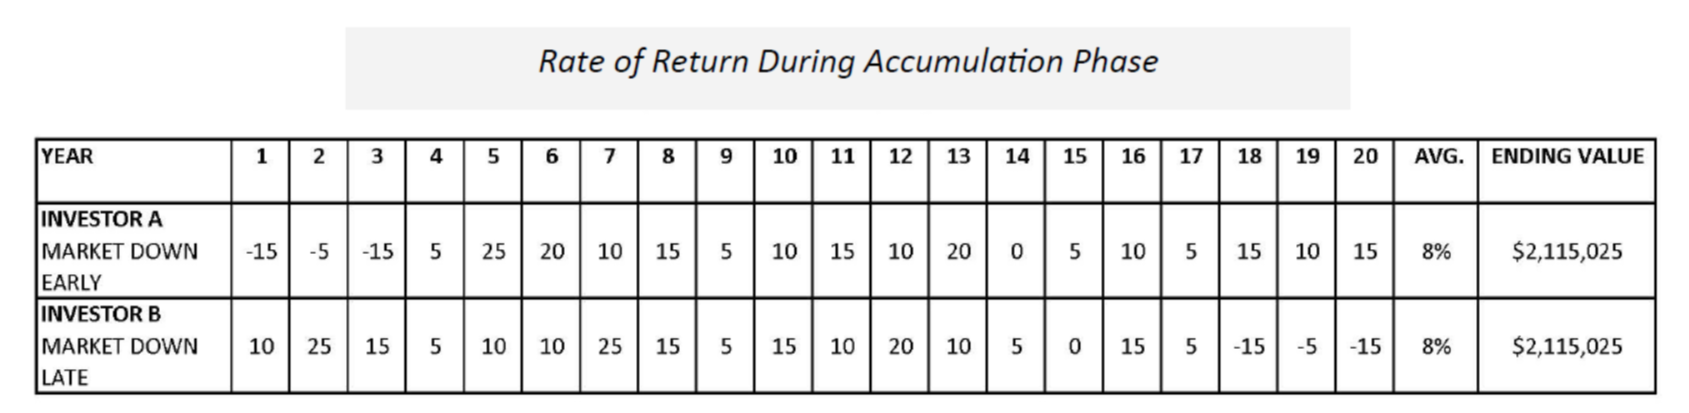
The chart above compares two investors who both average 8% annually on an initial investment of $500,000 over 20 years, but get there on much different paths. Investor A’s first three years have negative returns and a string of positive ones at the end. Investor B has very good returns early on with some negative years at the end. Assuming both remained fully invested the entire time, they end up with the exact same value at the end of 20 years: $2,115,025.
However, once an investor begins to withdraw annual income, the sequence of annual returns is a critical factor in maintaining or growing principal. Consider the chart below:
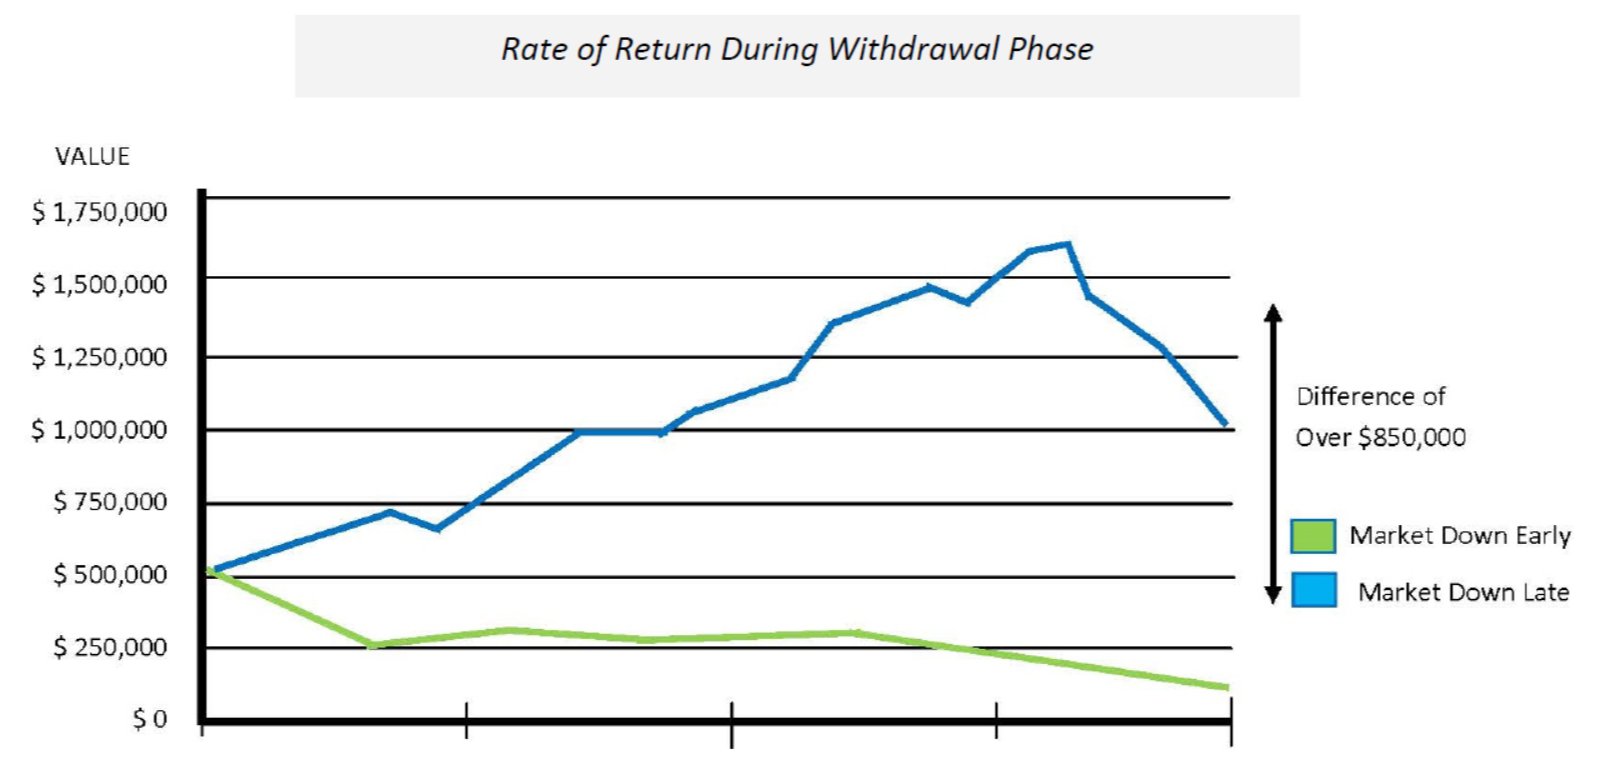
These are the same two investors as in the previous chart, each investing $500,000 initially. The only difference is that they begin to withdraw 5% annually immediately, with a 3.5% annual increase in the withdrawal amount for inflation.
How can it be that Investor A and Investor B both averaged 8% annually, and withdraw the same amounts but Investor B ends up with over $1 million while Investor A has less than $200,000?
Investor B was lucky enough to experience a series of good annual gains early on with no significant losses until the end, providing enough capital gains to offset the steep losses at the end of the 20 year period. However, poor Investor A had three years of significant losses right at the beginning, and the portfolio was reduced so much that it was never able to recover even though the market had strong gains during the next few years.
As investment advisors, one of our primary objectives is to “manage” the range of potential returns as much as possible without managing out the potential for long-term growth. In addition, it is important that we attempt to avoid significant capital losses in the years immediately preceding and following retirement.
Getting as close as possible to the “8% Returns Guaranteed Sign”
When explaining how we manage risk and volatility to new clients, I often joke with them that if we could put a sign out by the road that read “8% Returns Guaranteed,” we would have a line of investors stretching for miles who had cashed in low investment savings accounts and CDs to invest at 8%. I also tell them that if it says “too good to be true,” it always is. I don’t know of any investments that guarantee returns anything close to 8% per year and historical average returns are typically even lower.
For retirees withdrawing 3%- 6% of their portfolio annually, we see our job as attempting to get as close as possible to the 8% number on the fantasy sign by the road over the long term. Our strategy is to commit to a long-term stock/bond allocation that has historically reduced the range of potential returns but still provides the potential for long-term returns to exceed withdrawal percentages enough to offset inflation.
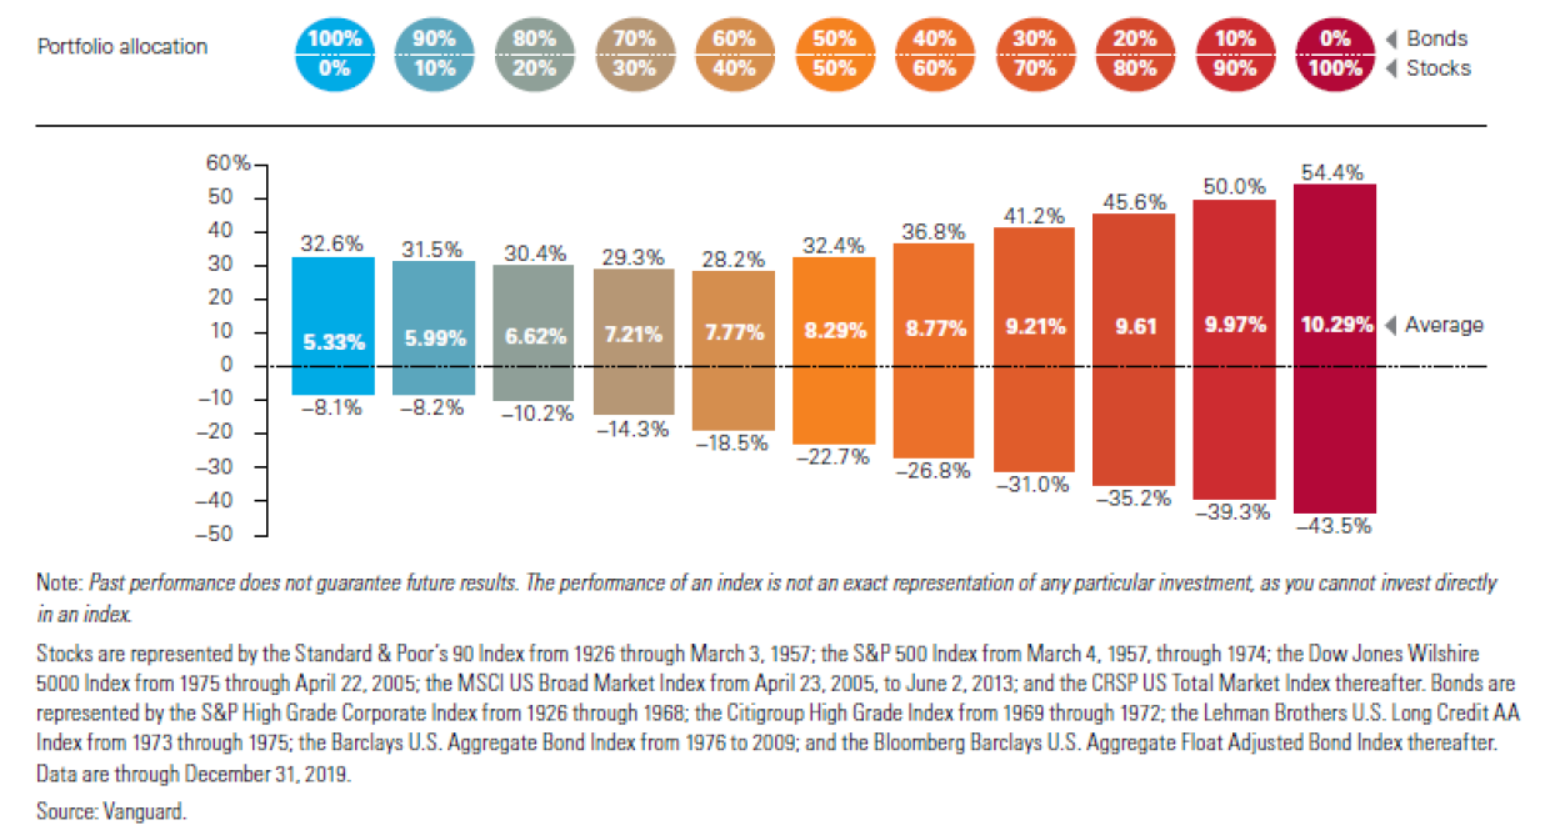
The chart above shows hypothetical combinations of stocks and bonds, their average returns and their highest gain and biggest loss since 1926. No surprise that the highest average annual return is from a 100% stock portfolio. However, as I have shown earlier, the Sequence of Return Risk would be way too high in that portfolio as evidenced by the 43.1% loss in the worst year (2008).
Take a look at the 40% bond 60% stock allocation. It has 85% of the average annual return of an all stock portfolio, but only 62% of the maximum downside risk as measured by the worst annual loss. Not surprisingly, our normal target allocation for most investors withdrawing 3%-6% income annually is about 60% stock and 40% bond. What we hope to do over time is select active managers who outperform the index and adjust normal targets based on an assessment of the current economic cycle. In addition, we slice off little pieces of the conservative core to invest in smaller companies, international companies, and high yield bonds.
If you are a retiree who feels as though you missed out on the last five years of stock market growth, you should proceed with caution and resist the temptation to dramatically increase the risk in your portfolio in an attempt to make up for lost time in the market. Instead consult with your financial advisor to design a long-term asset allocation strategy with systematic reallocation in place. However, be willing to accelerate your reallocation if the greed that has crept into the markets over the last few years suddenly turns to fear that causes “lawn sale prices” on great companies.
*VANGUARD. U.S. STOCK MARKET RETURNS BASED ON STANDARD & POOR’S 90 INDEX FROM 1926 TO MARCH 3, 1957; S&P 500 INDEX FROM MARCH 4, 1957, THROUGH 1974; DOW JONES WILSHIRE 5000 INDEX FROM 1975 TO APRIL 22, 2005; MSCI US BROAD MARKET INDEX FROM APRIL 23, 2005, TO JUNE 2, 2013; AND CRSP US TOTAL MARKET INDEX THEREAFTER. ASSUMES ALL DISTRIBUTIONS WERE REINVESTED. PAST PERFORMANCE IS NOT A GUARANTEE OF FUTURE RESULTS. THE PERFORMANCE OF AN INDEX IS NOT AN EXACT REPRESENTATION OF ANY PARTICULAR INVESTMENT, AS YOU CANNOT INVEST DIRECTLY IN AN INDEX. SECURITIES OFFERED BY LPL FINANCIAL, MEMBER FINRA/SIPC.
The opinions voiced in this material are for general information only and are not intended to provide specific advice or recommendations for any individual.
All performance referenced is historical and is no guarantee of future results. All indices are unmanaged and may not be invested into directly.
The examples presented are hypothetical and are not representative of any specific situation. Your results will vary. The hypothetical rates of return used do not reflect the deduction of fees and charges inherent to investing.
Securities and advisory services offered through LPL Financial, a registered/Investment Advisor, Member FINRA/ SIPC.